Oh man, everyone thought 2020 was on shuffle, but boy what a careful narrative building!
Tonight, @FLOTUS and I tested positive for COVID-19. We will begin our quarantine and recovery process immediately. We will get through this TOGETHER!
— Donald J. Trump (@realDonaldTrump) October 2, 2020
Yes, Trump was infected with covid-19, and as the title suggests, Twitter was the place to be. That tweet gained popularity from left and right and made some observant individuals wonder about its traffic’s ideological distribution. Are the people engaging with this tweet mostly show their support for Trump, or are they here to gloat?
Luckily, this is an empirical question. We can sample some of the engagement (i.e., retweets) and estimate their political ideology.
Sample Engagement
I’ll start with the caveat: as for now (afaik), the Twitter API does not provide information about who likes a tweet (which may be where most of the gloating happens). However, it does support retweeters, so we can see what accounts retweeted Trump’s covid tweet.
There are several packages to pull info from Twitter, yet my favorite one by far is rtweet (Kearney, 2020).
Once you set your API tokens, getting retweeters is a piece of cake:
retweeters <- rtweet::get_retweeters(status_id = "1311892190680014849")
This function is limited to 100 users for a given status, so I wrapped it in a loop until it returned a couple of thousands of retweeters. This will be our sample for ideological estimation. We can then look them up to get their screen name and all the info we need further down the road.
users <- rtweet::lookup_users(retweeters$user_id)
Ideological Estimation
How does one estimate ideology on Twitter? There are several ways, however, the most popular one I know of (perhaps due to my own psych bias) is the Barberá method (Barberá et al., 2015). I won’t get much into the technical stuff, but in broad terms, it uses your Twitter network.
There are accounts of individuals (e.g., politicians, public figures) and institutions (e.g., newspapers) that we pretty much know their political orientation. Given a certain user follows some of these high profile accounts, the algorithm can infer the user’s political orientation (interesting, right? read the paper!). This means that for every user in our sample of Trump retweeters, we need to get their entire (or actually max 5000) network of people they follow (aka “friends” in the Twitter API jargon) to estimate their ideology.
I don’t think Twitter particularly likes that because it allows for 15 network calls every 15 minutes, which really backlogs the estimation process.
To use the ideological estimation algorithm, first, you should follow the explanation here. Then, the rest of the process looks like this;
library(tweetscores)

#pre allocate ideology vector
users$ideology <- NA

#loop
for (i in 1:dim(users)[1]) {
  user <- users$screen_name[i] #assign screen name to 'user'
  if (!is.na(user)){
    friends <- getFriends(screen_name=user, oauth="~my_oauth")
    #sometimes the loop breaks because there are no known friends,
    #this is why I wrapped it in a tryCatch
    tryCatch({
      users_name$ideology[i] <- estimateIdeology2(user, friends)
    }, error=function(e){})
  }
}
Plot it like it’s hot
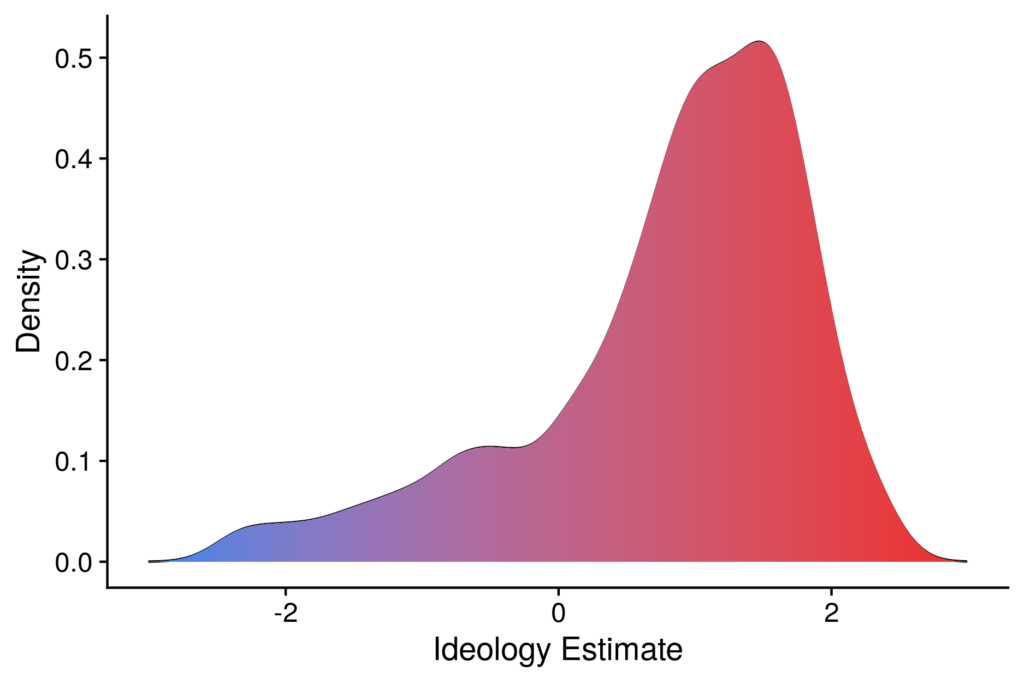
It looks like we got 753 accounts with known ideology. Not bad!
What is their ideological distribution?
I wanted to make a density plot and fill it with ranging colors from blue to red. For some reason geom_density won’t work, so thanks to Google and StackOverflow, I found a workaround:
library(tidyverse)

x <- na.omit(users$ideology)
y <- density(na.omit(x), n = 2^12)

ggplot(data.frame(x = y$x, y = y$y), aes(x, y)) + geom_line() +
  geom_segment(aes(xend = x, yend = 0, color = x)) +
  scale_color_gradient(low = 'dodgerblue2', high = 'firebrick2') +
  labs(x = "Ideology Estimate", y = "Density") +
  cowplot::theme_cowplot() + guides(color=FALSE)

I ❤ pretty plots.
The X-axis corresponds to ideology, wherein negative values stand for liberal views and positive values for conservative views. The Y-axis corresponds to the probability density function.
So what do we have here?
We definitely see that most retweeters from our sample are right-leaning, which may suggest most gloating happen on subtweets.

I should note, though that my ad-hoc sampling technique could be subjected to bias. For instance, it could be the case that the tweet was especially trending among conservatives in the specific moments when I pulled the retweets, so take this exercise with a grain of salt.
2 thoughts on “Trump Got COVID and Twitter Is on Fire”